Batch Search
mzXML Format File:
At present, MS2 batch search only supports mzXML format files as input, this a example.
The Thermo RAW file can be converted to mzXML format by tools: RawConverter
Other MS2 spectrometry file can be converted to mzXML format by software: pwiz-setup-3.0
Single Work Pipelines:
When you click on batch search, you can select two pipelines in the function screen, single work and group work. When you select single work, you can do raw data annotation in a single sample mode. This is shown in the figure below.

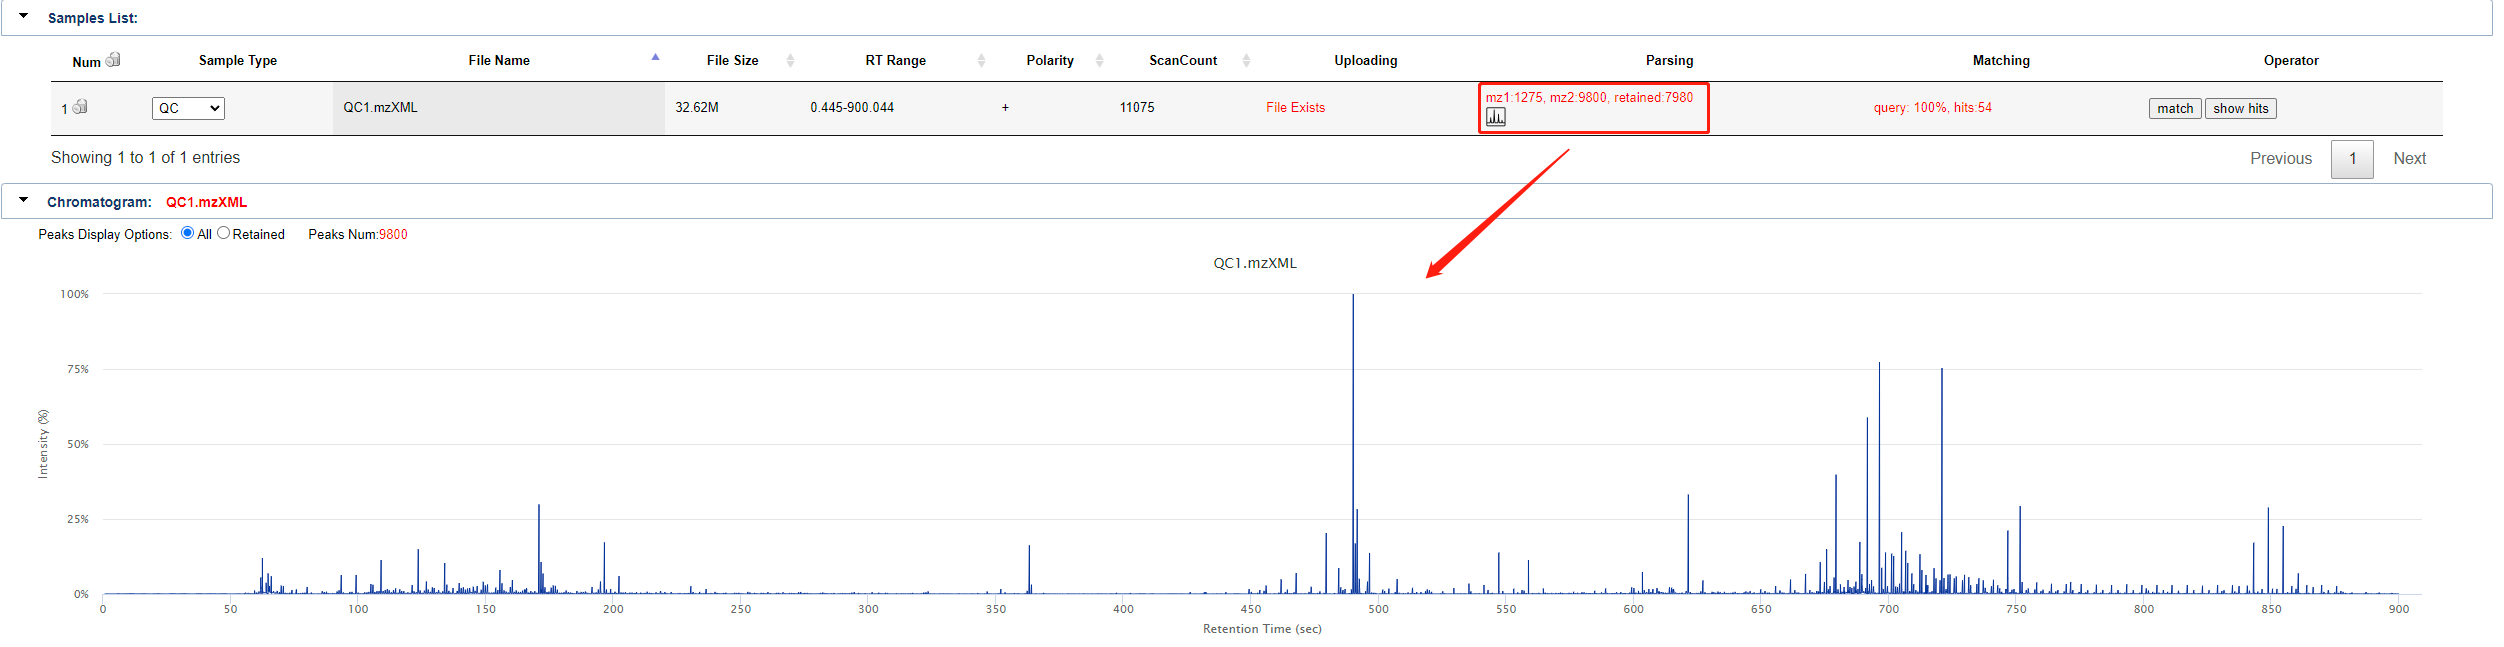
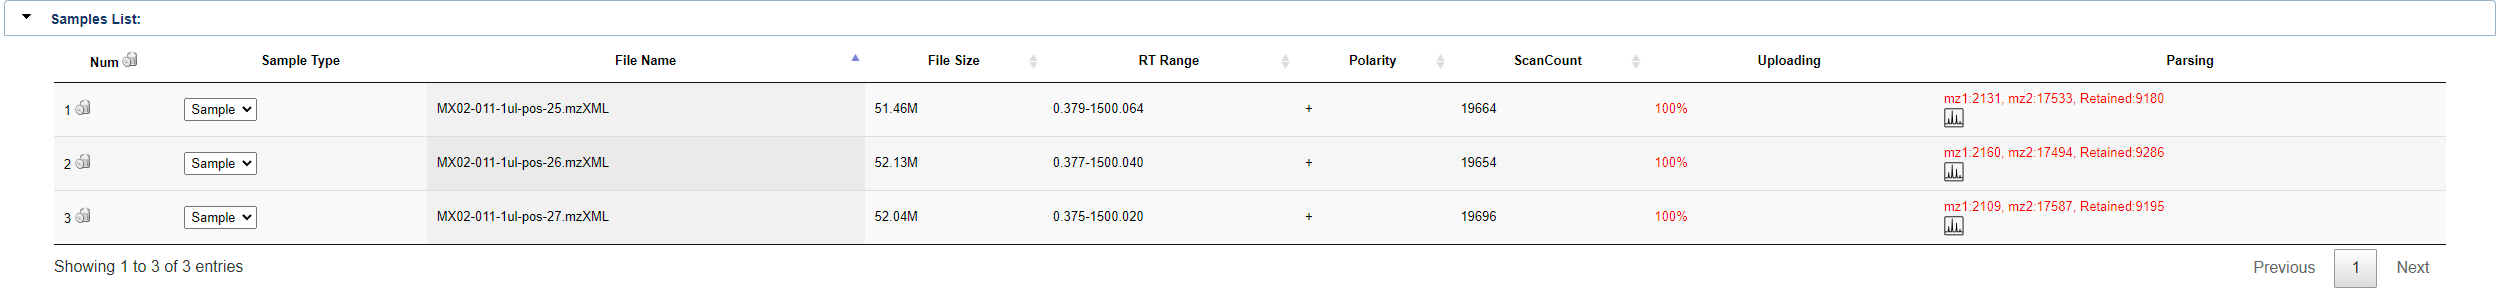
Once uploaded sample (in mzXML format), you can click run query to perform the upload and match operation. If the file has already been uploaded, it will look like this. The sample list shows the sample type, file name, file size, RT Range, polarity, scancount, upload status, parsing status, match status, etc. of the sample.

Click on the small icon in the parsing status to get the detailed results of the chromatogram, as shown in the figure.
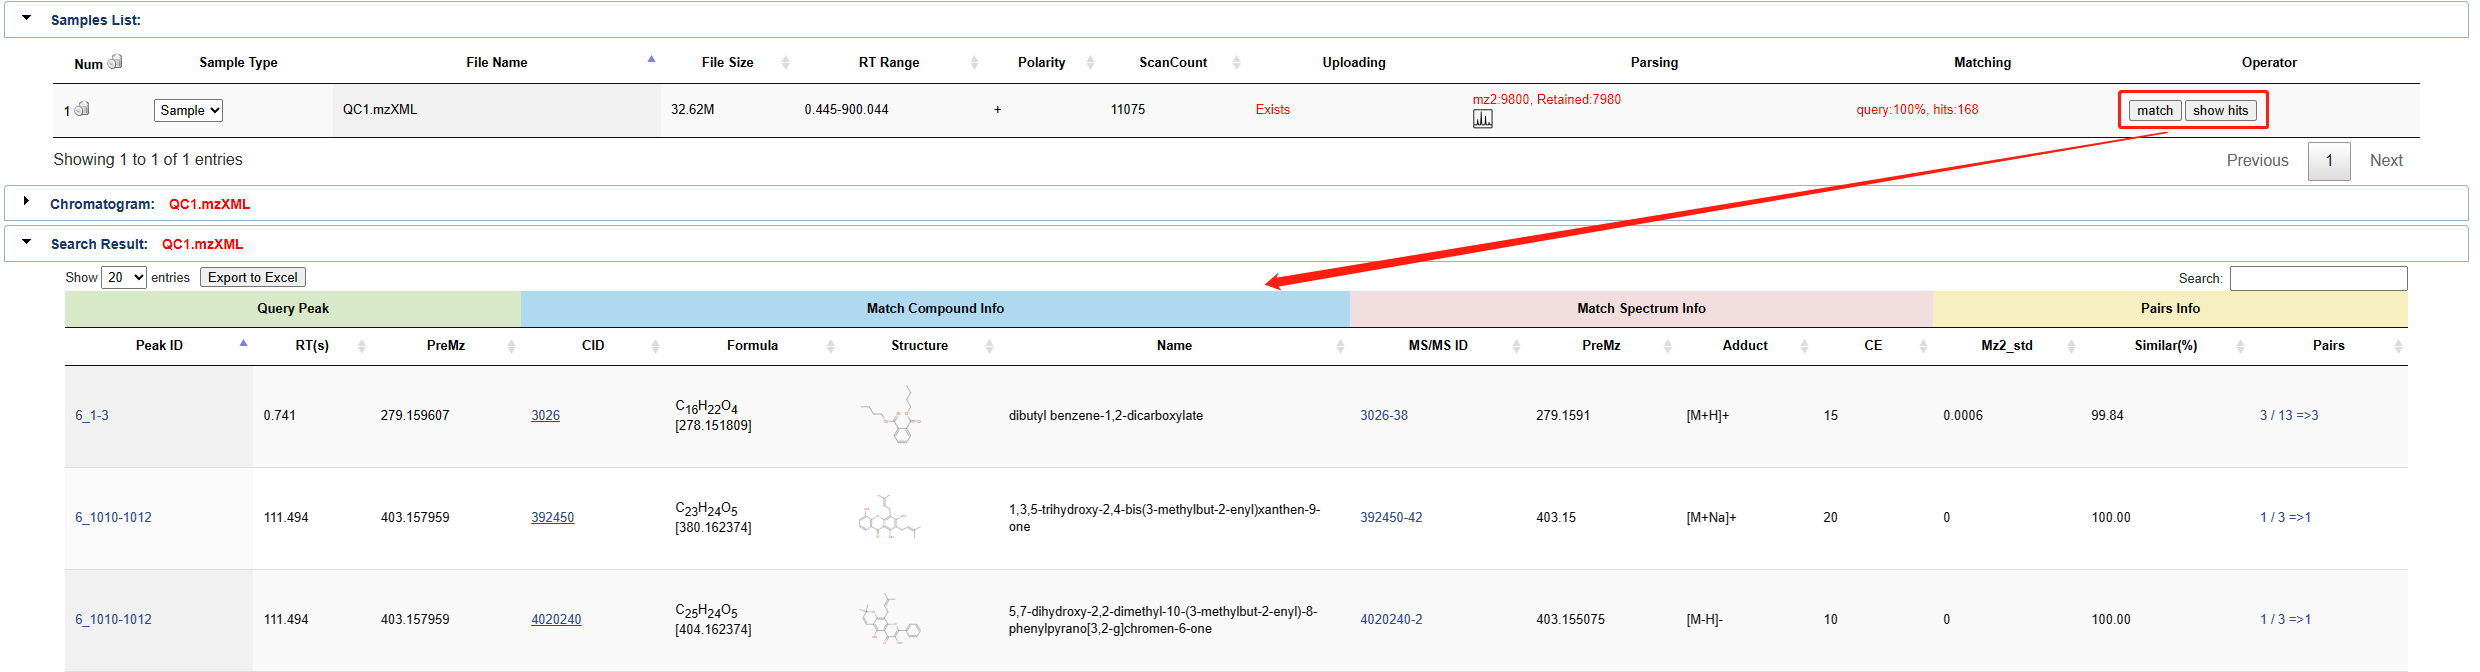
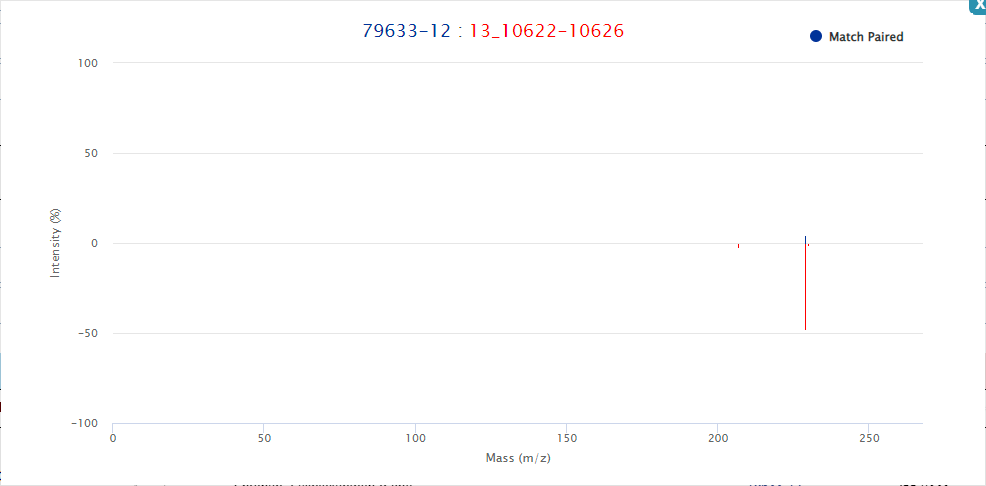
Click the match button in the action bar to compare the sample with the database to get the annotation result. Click the show hits button to view the results. As shown in the figure. The search result shows Query peak, match compound info, match Spectrum info and match peaks info, etc.
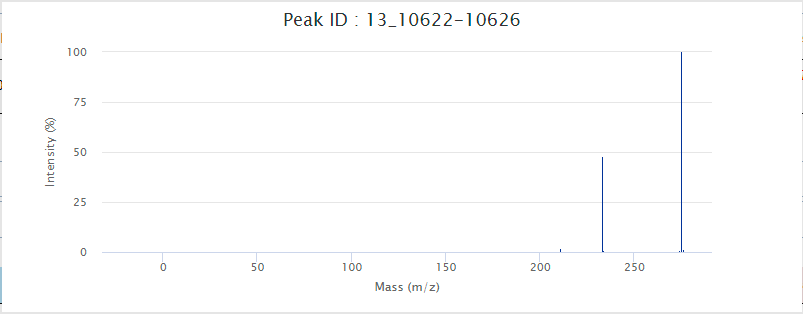
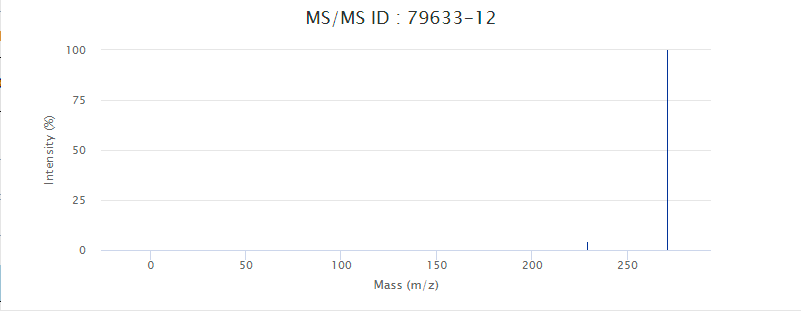
Click the link in the corresponding field in the query result can lead to detailed interface or enlarged figures of the corresponding content. For example, Peak ID, MS/MS ID, and Match Peaks, as shown in the figure.
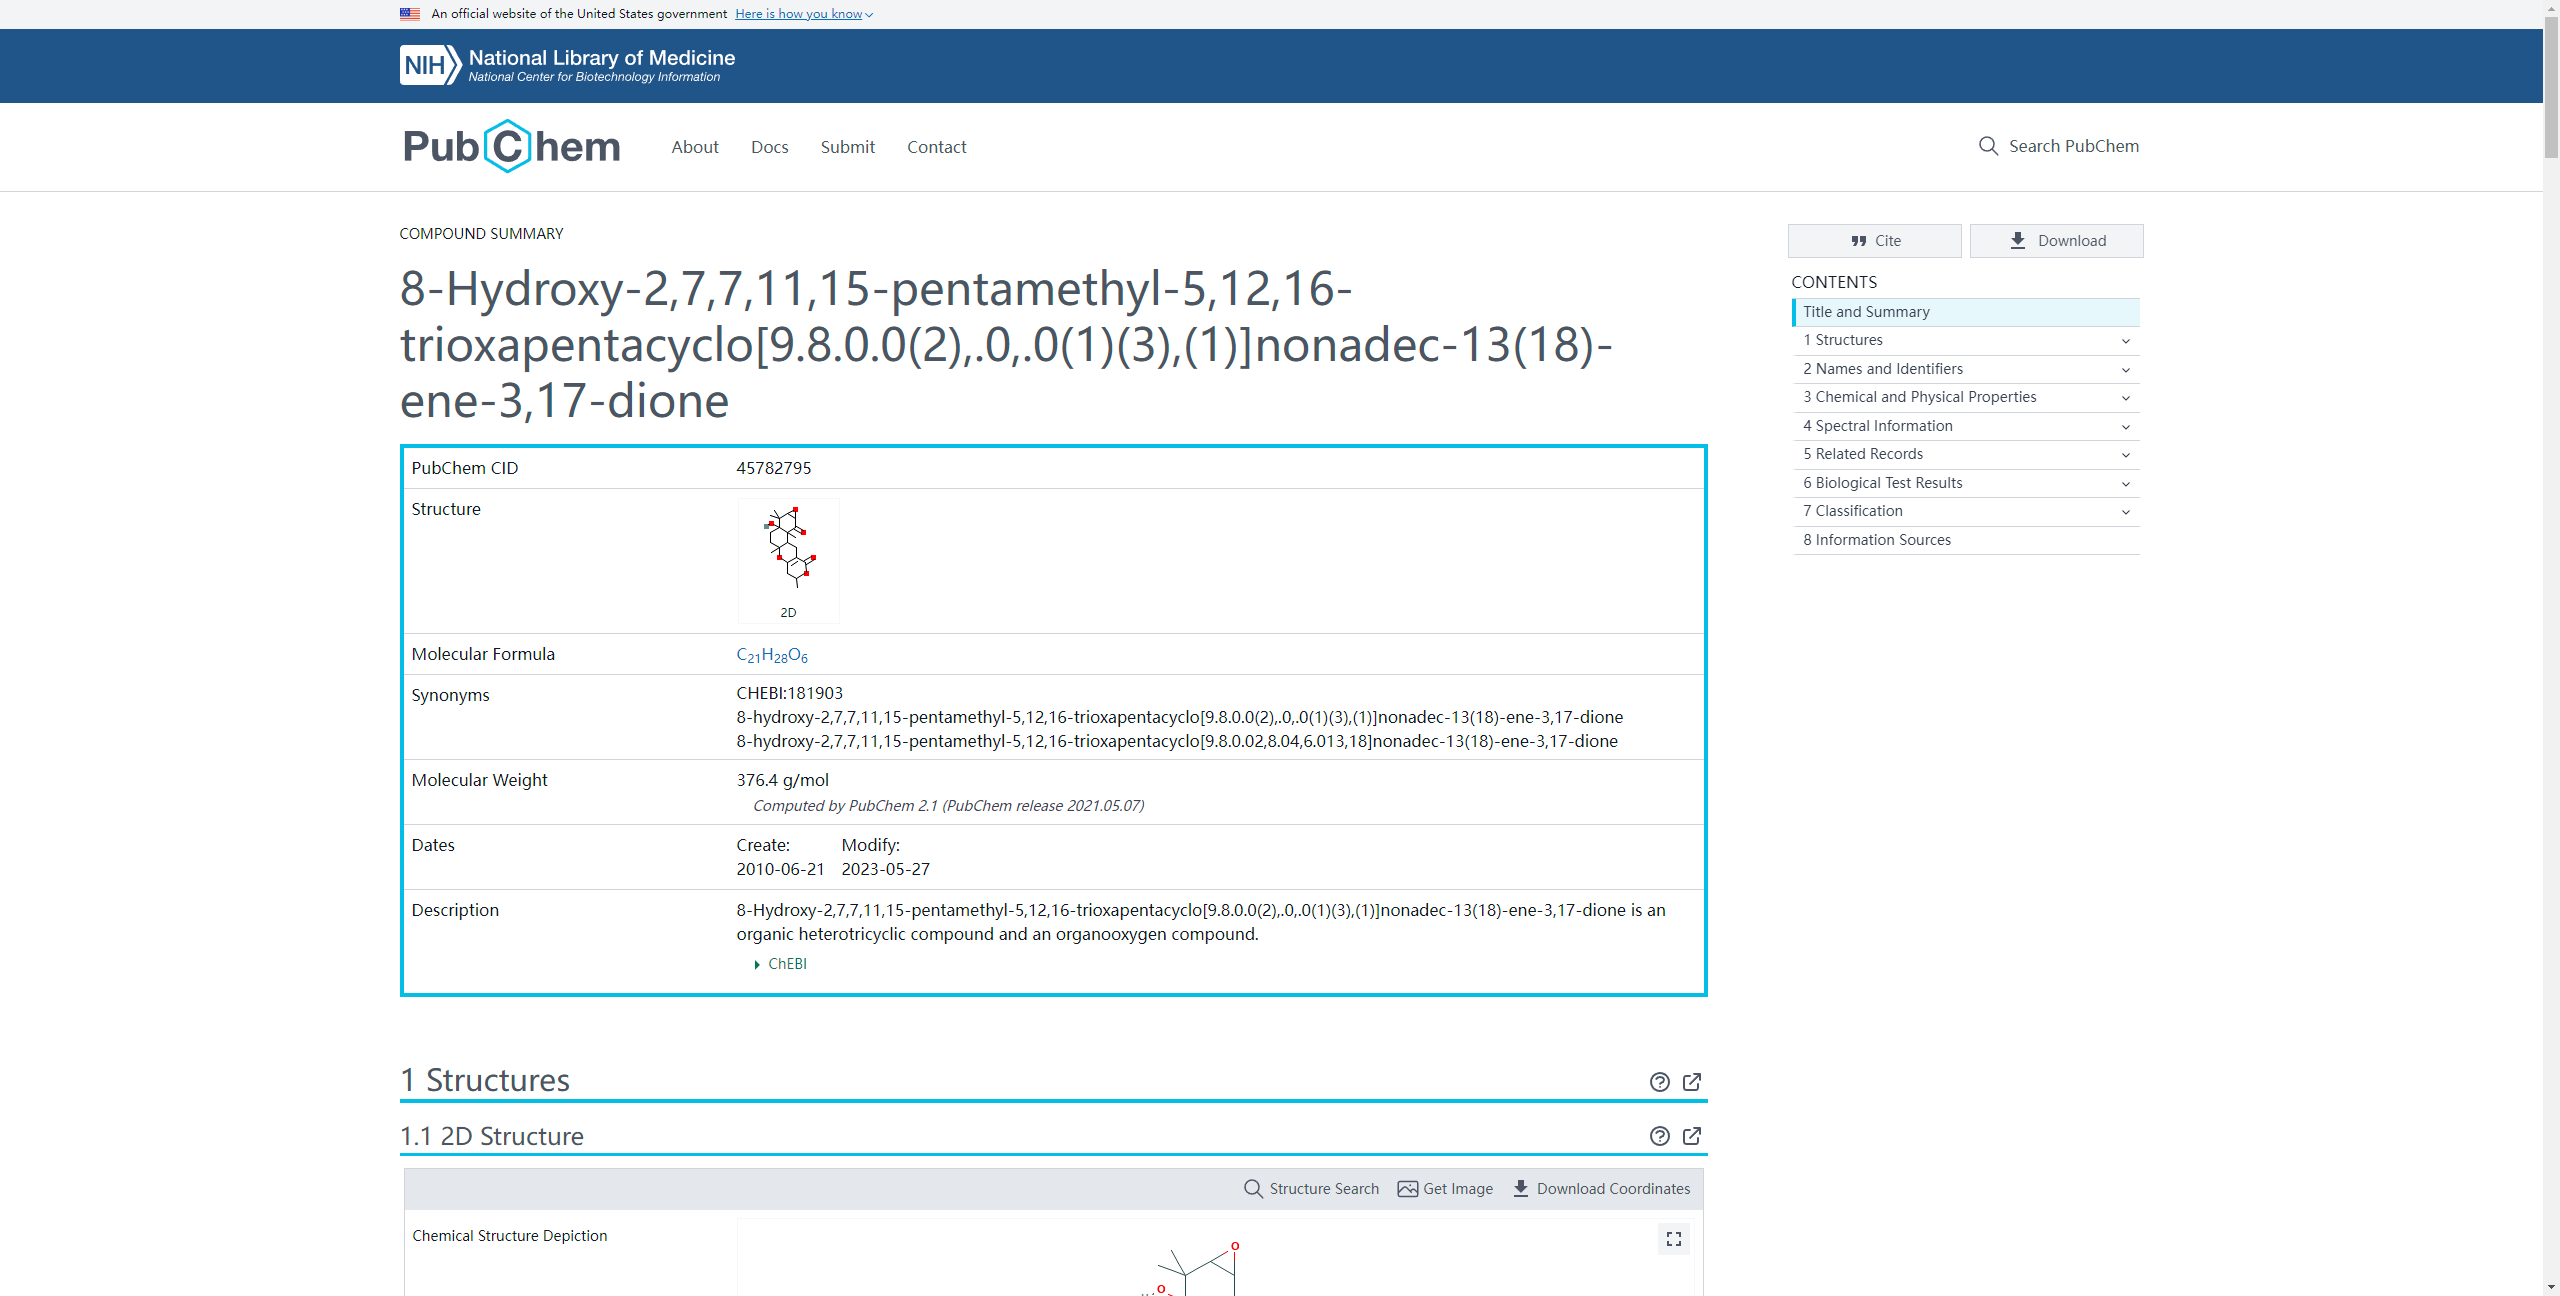
Click on the corresponding compound ID will transfer your explore to the detailed information page of the corresponding compound in NCBI.
Group Work Pipelines:
When you select group work, you need to select at least two sample files. Then click the upload button can upload the raw data to nodes.

Similar as single work, the details of the samples are displayed in the samples list. Upload and parsing progress will also be updated in real time.

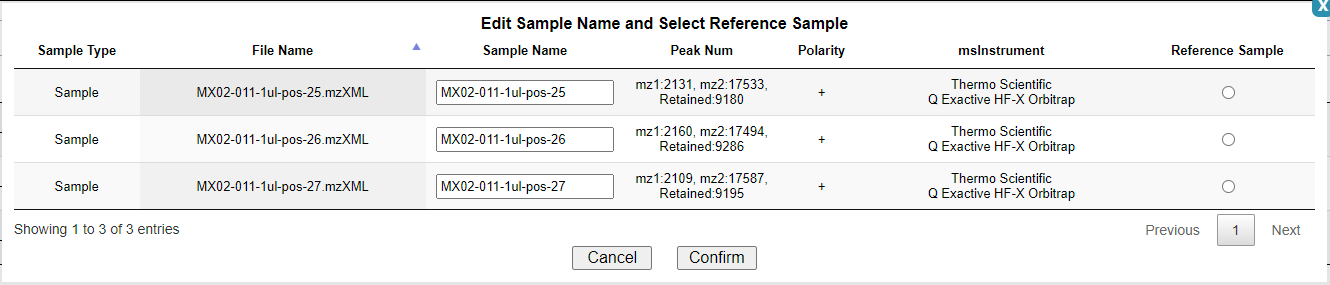
After all samples are uploaded, you can click the Run Adjust button to select reference samples and complete Group Alignment for adjust RT. As shown in the picture.

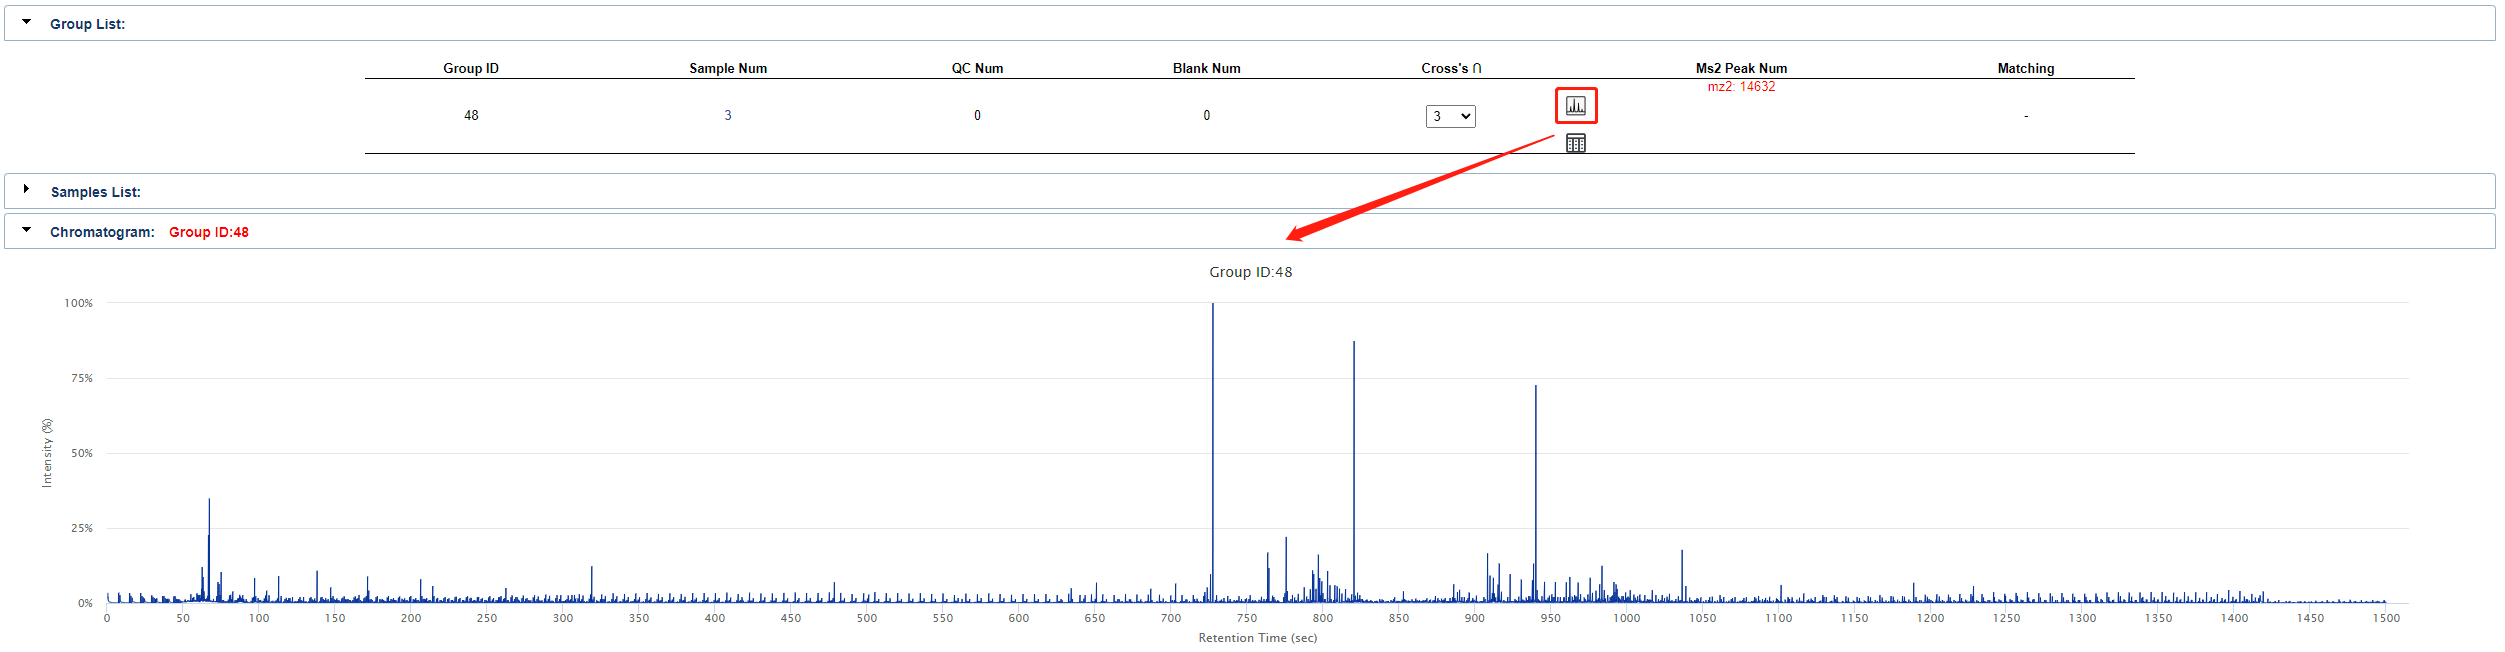
Click the button in the circle below shown to see a Chromatogram of the currently uploaded set of samples.

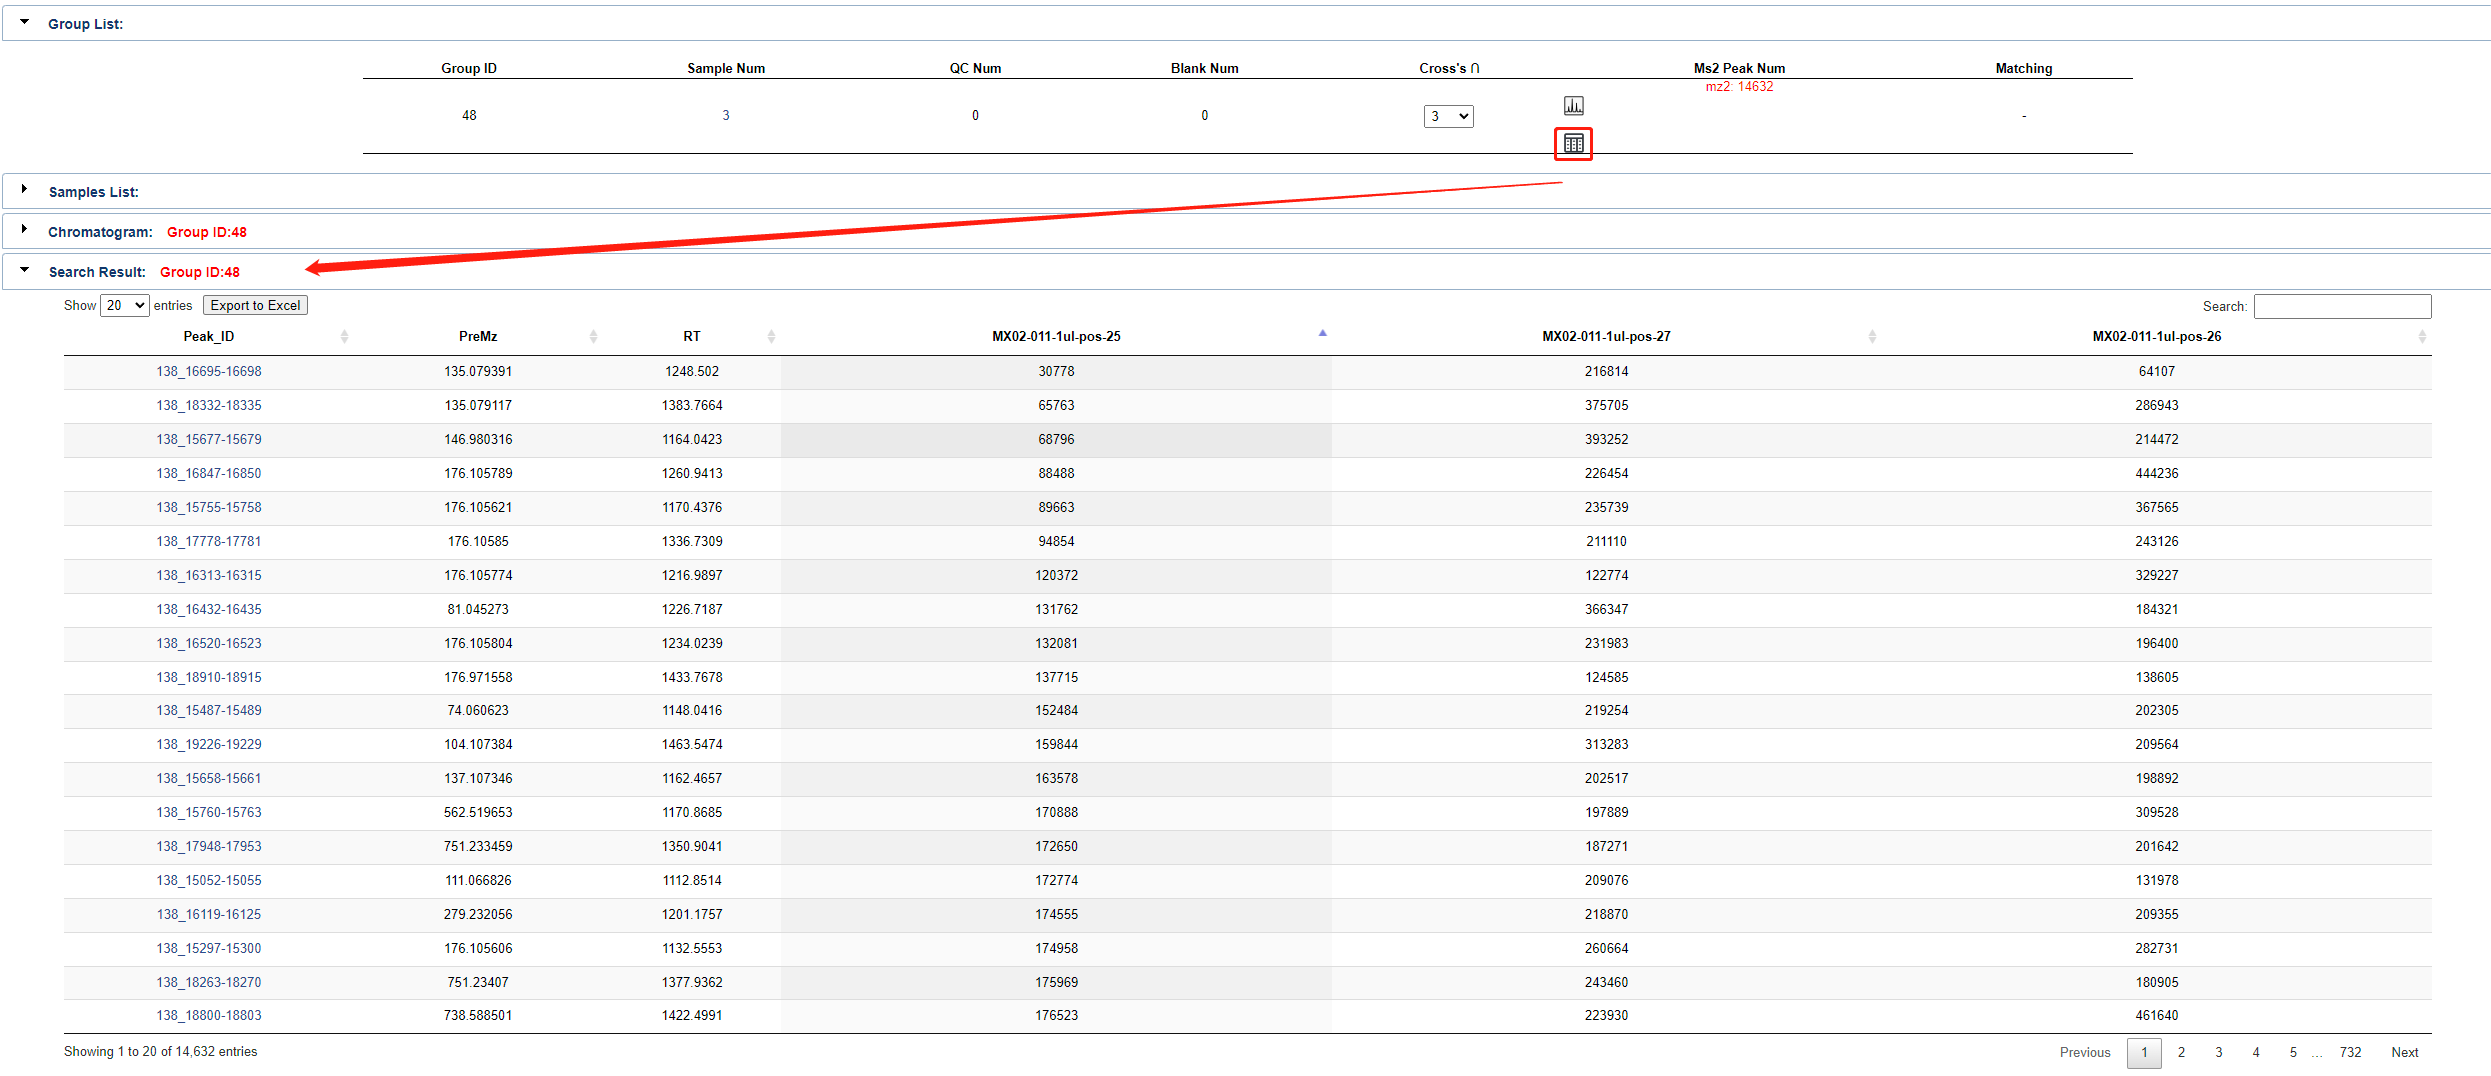
Click the button in the circle below shown to see the query results based on this set of samples.
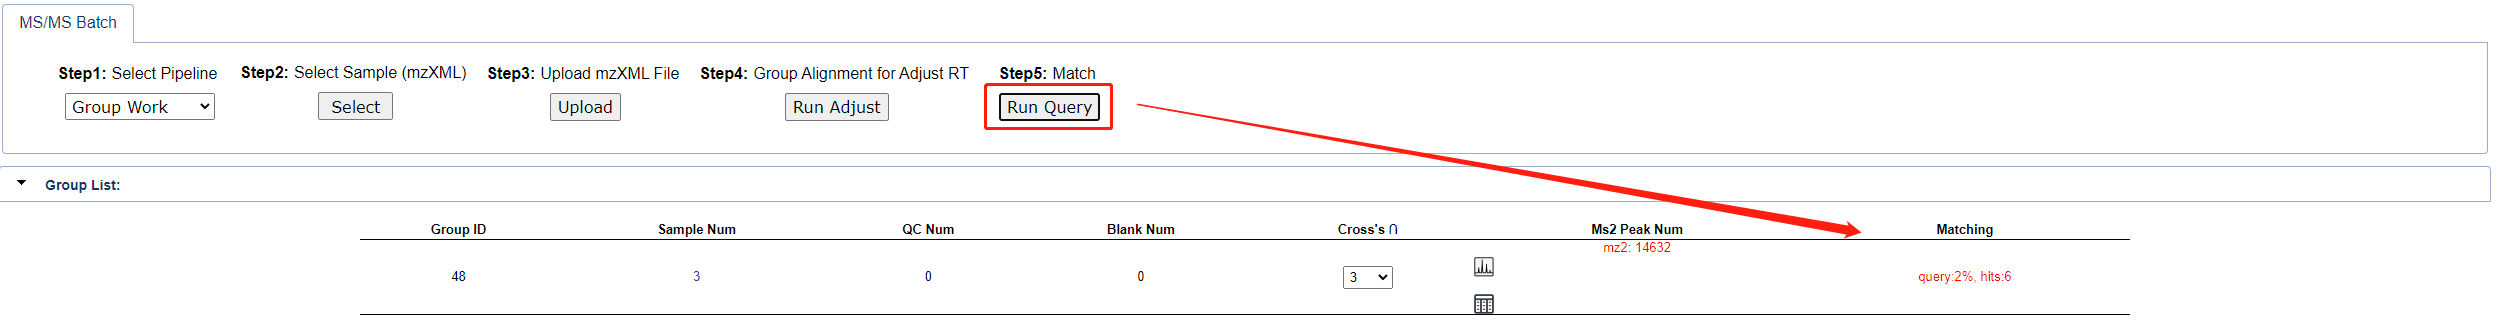
Finally, click the Run Query button to start the matching process. The progress will be shown in the table below.
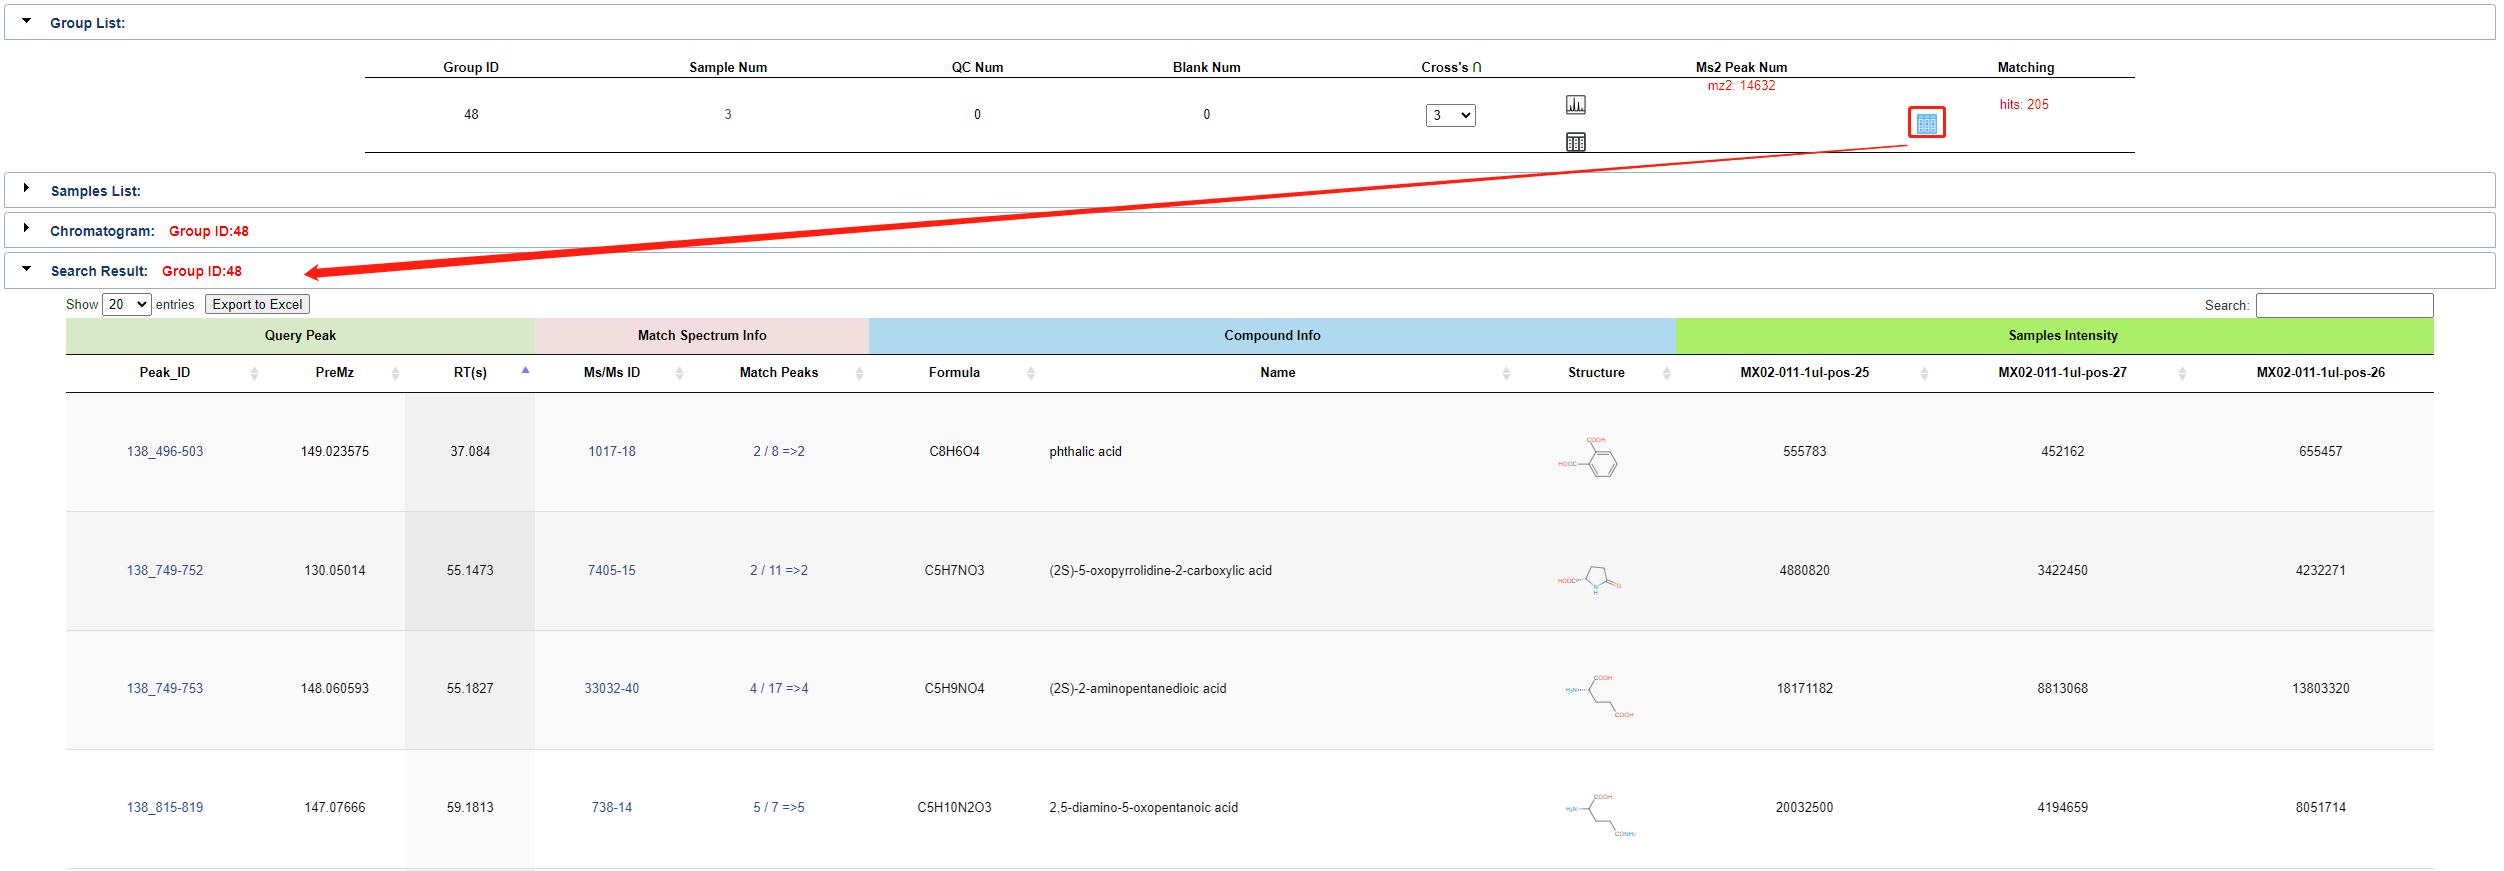
Once match completed, uou can click the button shown below to view Query Peak, Match Spectrum Info, Compound Info and Sample Intensity. Same as single work, users can also click the link in the detailed query result to access detailed information about the object content.
Created with the Personal Edition of HelpNDoc: Effortlessly bring your documentation online with HelpNDoc